基础
最近还是在弄片刻的东西,只是偶尔才有时间开始慢慢弄,但是还是在保持一直学习新的东西。其实片刻的1.0.0 版本已经做完了,但是我还不准备上线,因为我感觉这个片刻1.0.0 缺少一点东西,就感觉他跟我心中的那个系统有一点点不一样的地方。所以啊,还在打磨中,我自己也还在学习中。当然,这些不完美都是以我为标准的不完美,静候!
简介
前边说了那么多,其实还是为了学习一些新的东西,但是现在学习的也大都仅限于了解大致的运行原理,能够使用满足日常的开发需要即可,并没有很深入的去探究。
现在我基本上很少去看别人发的使用教程了,而是想学一个东西的时候,直接去找官方文档,虽然有时候需要翻译,但是在大部分的时候还是能够理解英文的意思即可。
如果你想看教程,在后面的引用中会放出来链接。
Prometheus
今天的主题就是Prometheus ,他是一个监视系统,并且能够存储从应用服务中获取到的监视数据,这就能够为我们做出其他的扩展提供了良好的基础。
有了Prometheus 还不够,你还需要Micrometer、 Grafana、 Actuator, 这些一起工作才能更好的提供一个良好的监视应用的环境,那么开始吧。
Actuator: 将应用程序中的指标以特殊的方式进行公开。
Micrometer: 从应用程序中获取到公开的应用指标。
Prometheus: 存储从应用程序中获得到的指标。
Grafana: 以图表的形式展示数据。
有了以上的四个组件,那么我们就能以一种更加透明的方式获取到应用的各项健康指标。
实践
依赖
pom.xml
1 | <!-- Spring boot actuator to expose metrics endpoint --> |
配置
application.properties
1 | #Metrics related configurations |
查看公开的指标信息
访问http://localhost:9000/actuator 你就会看到http://localhost:9000/actuator/prometheus 这条链接,访问这条链接,你就能看到应用从prometheus endpoint 释放的应用监控指标了。
Grafana
官方文档:https://grafana.com/
当然,Grafana 的教程也有,在下方。
下载对应你系统的Grafana 的最新版本,然后就是安装运行了,运行成功之后通过访问http://localhost:3000 就可以访问到Grafana 的登录页面,默认用户名和密码:admin-admin。
接下来就是具体的操作步骤:(在下面的教程中你可以找到具体的操作流程)
- 新建数据源。
- 导入预制的仪表板。
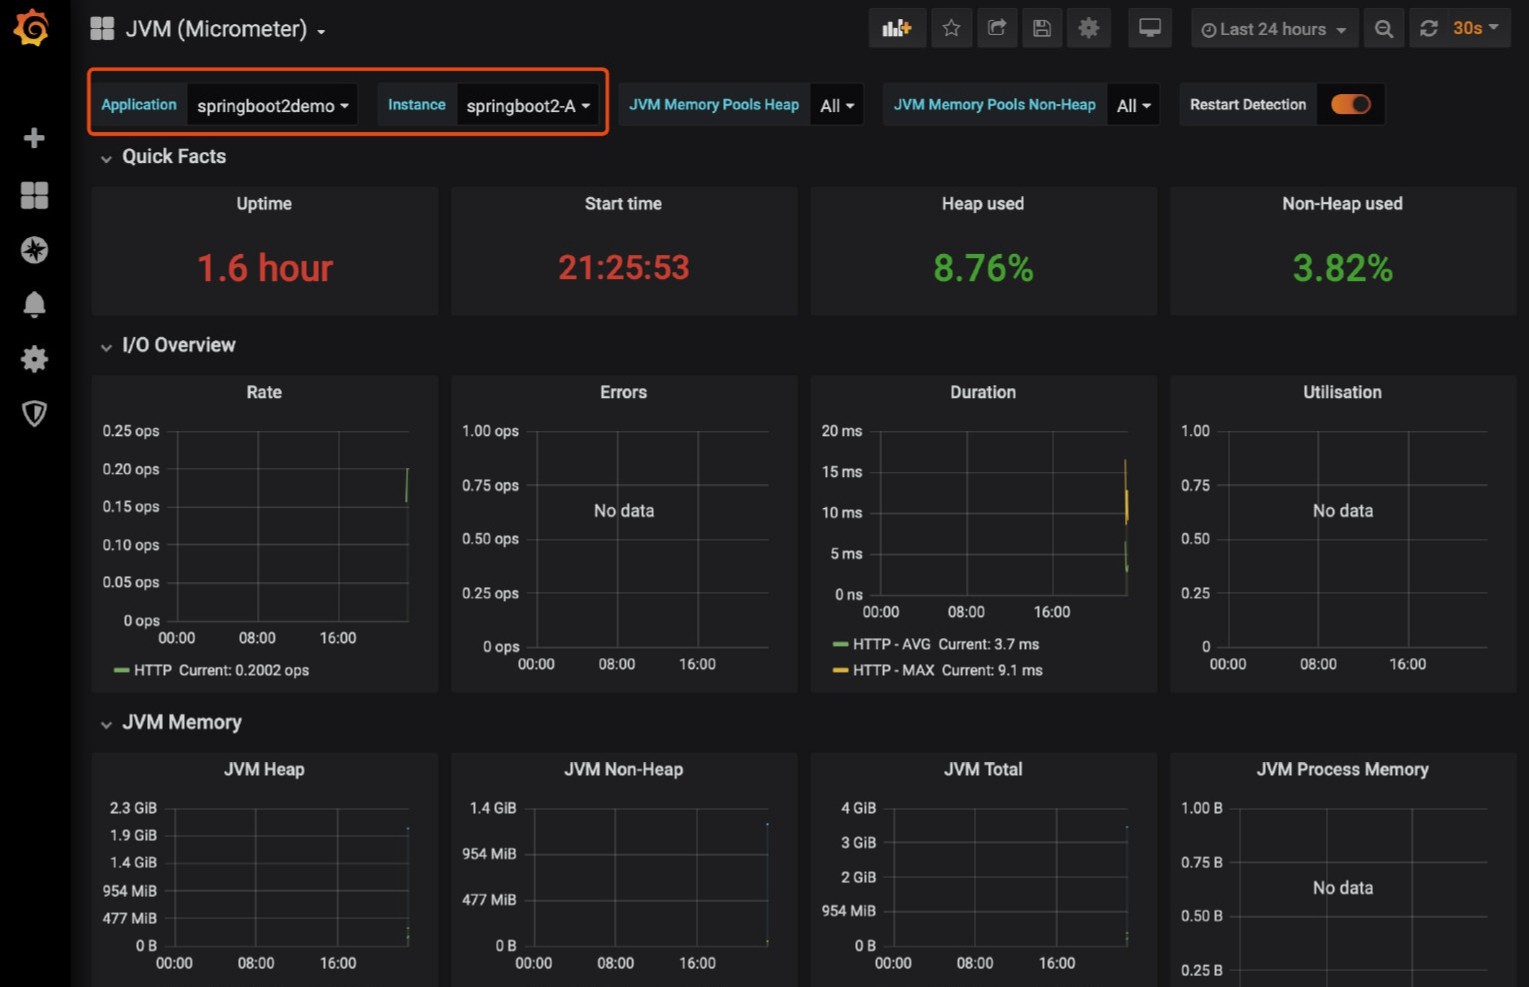
效果展示
后记
引用
https://dzone.com/articles/monitoring-using-spring-boot-2-prometheus-and-graf?tdsourcetag=s_pctim_aiomsg
https://stackabuse.com/monitoring-spring-boot-apps-with-micrometer-prometheus-and-grafana/?tdsourcetag=s_pctim_aiomsg
https://www.imooc.com/learn/1231
总结
在学习一种东西时,你首先应该去看的是官方文档,而不是各种教程,毕竟只有作者自己才知道他写的是什么东西!
个人备注
此博客内容均为作者学习慕课网《使用Prometheus实践基于Spring Boot监控告警体系》所做笔记,侵删!
若转作其他用途,请注明来源!